All of the work done on this page was conducted in ArcGIS Pro and Adobe Illustrator.
INTRODUCTION
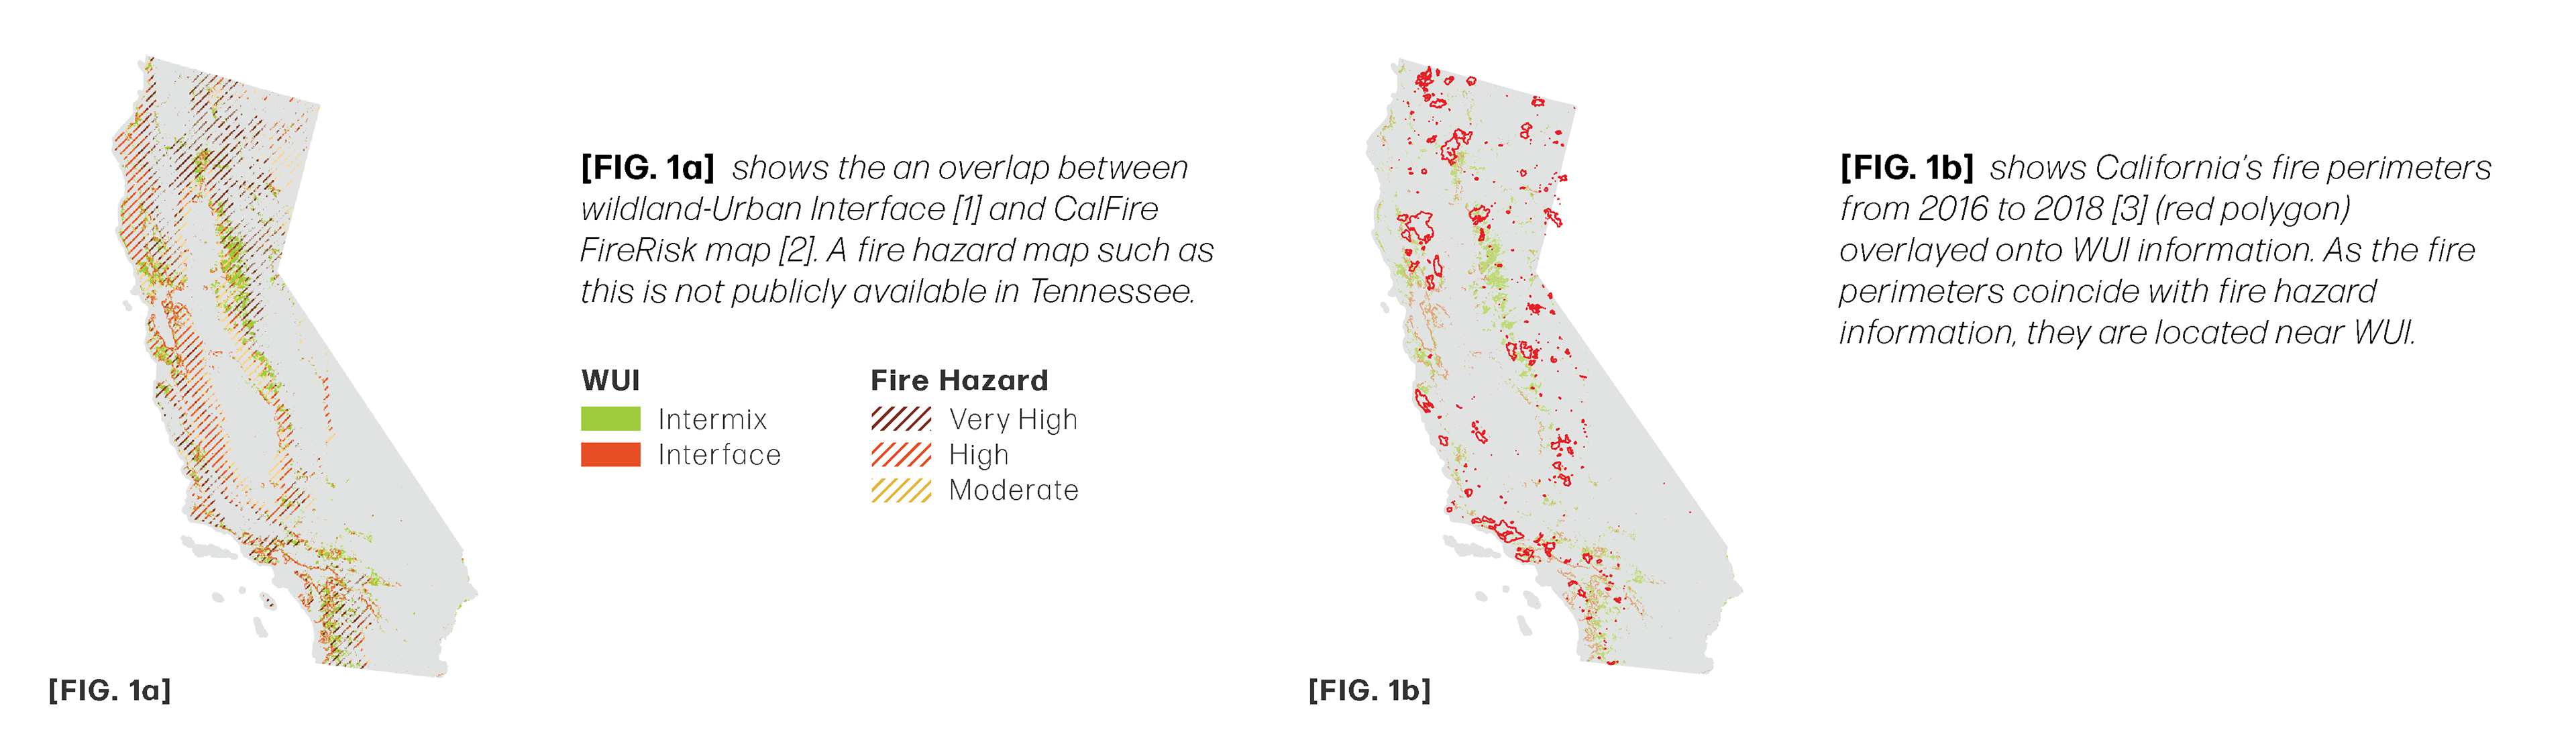
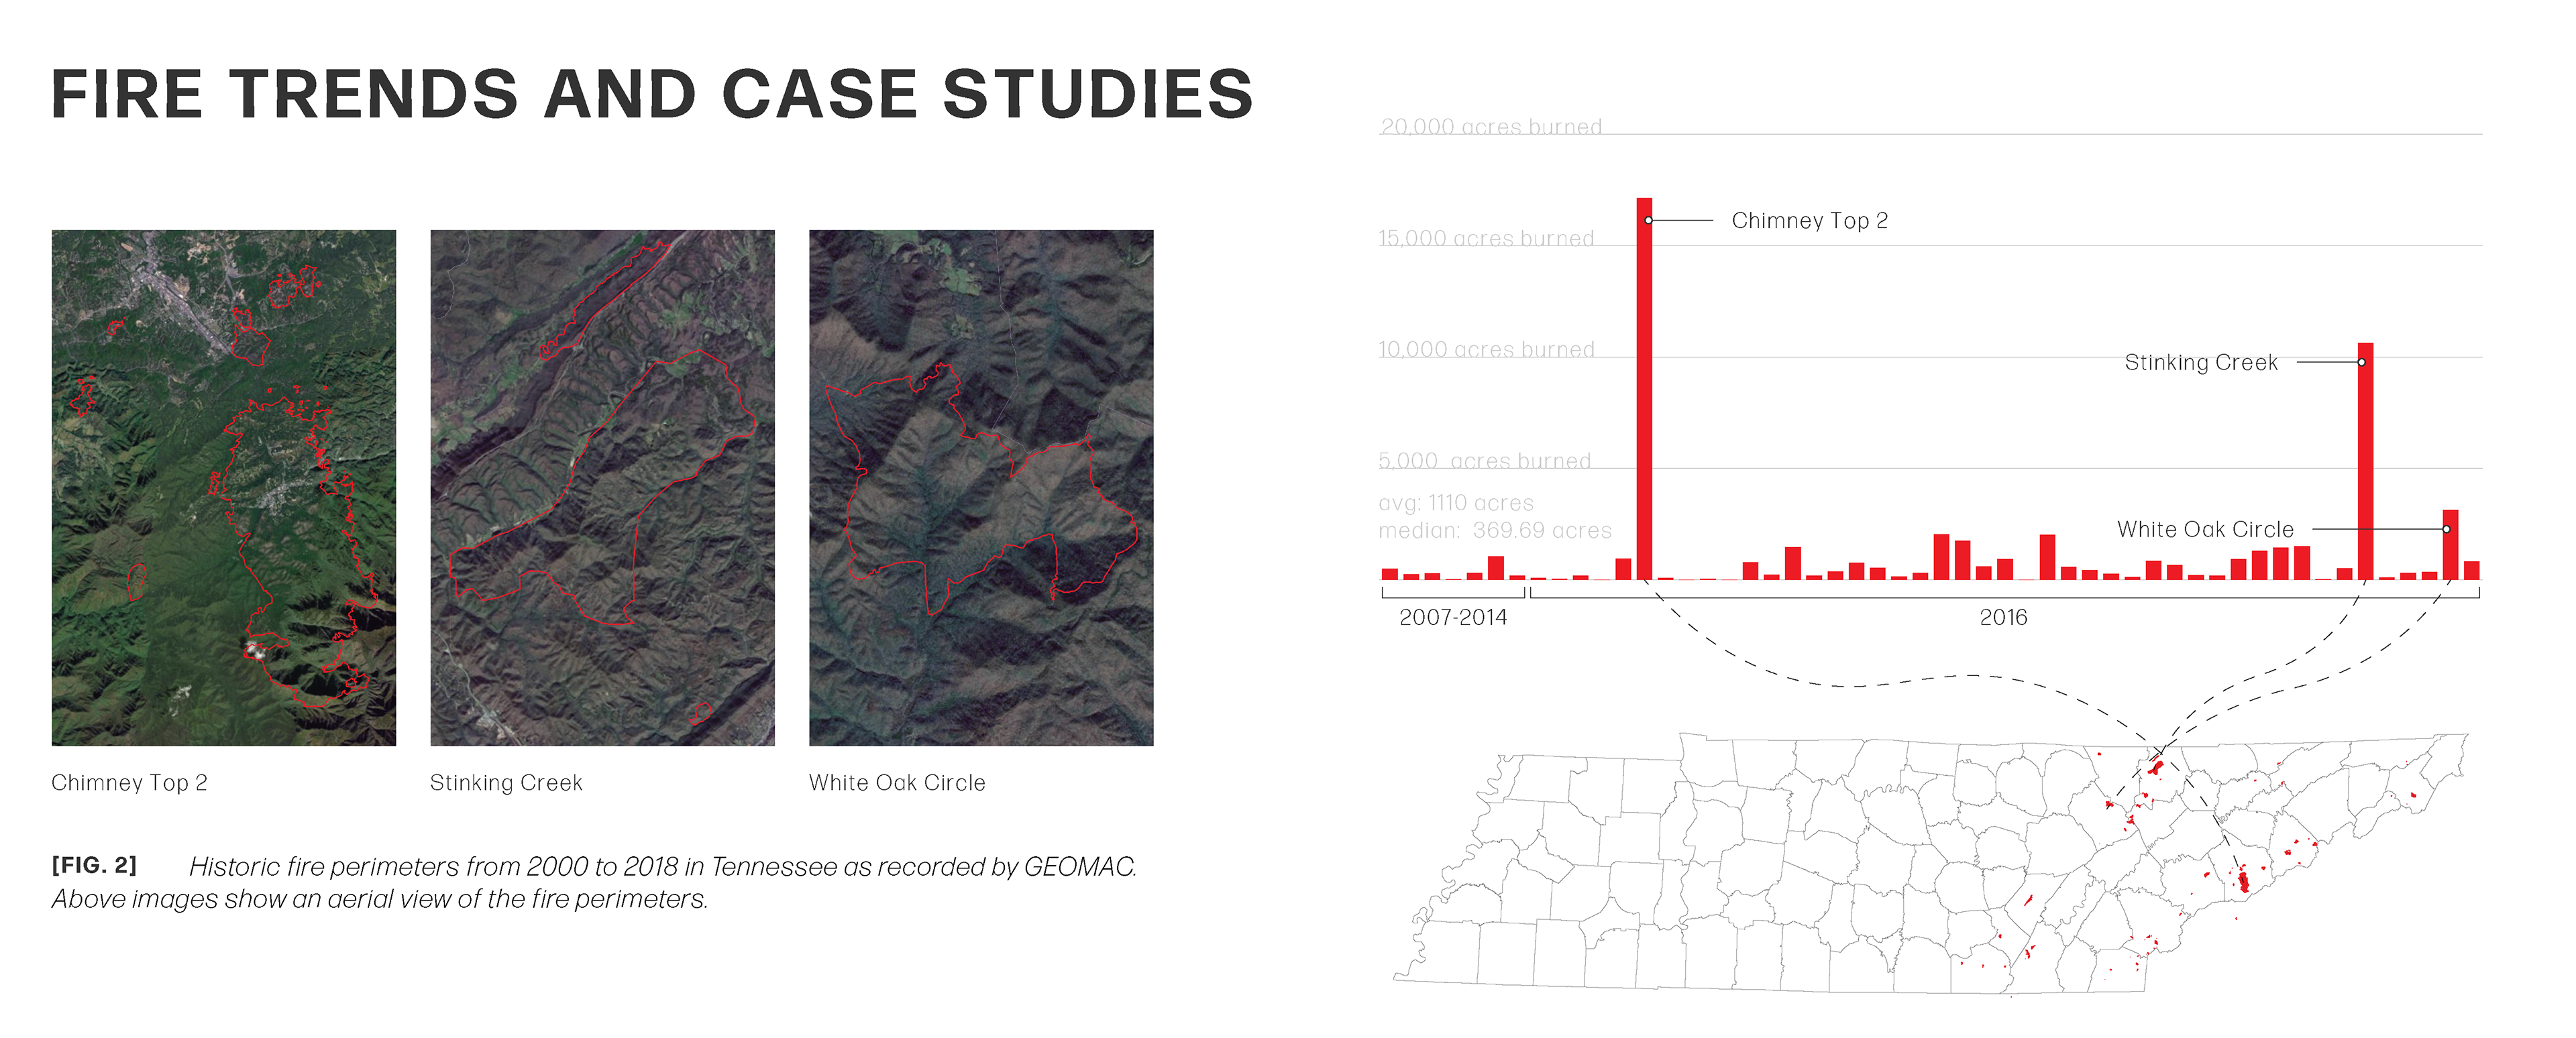
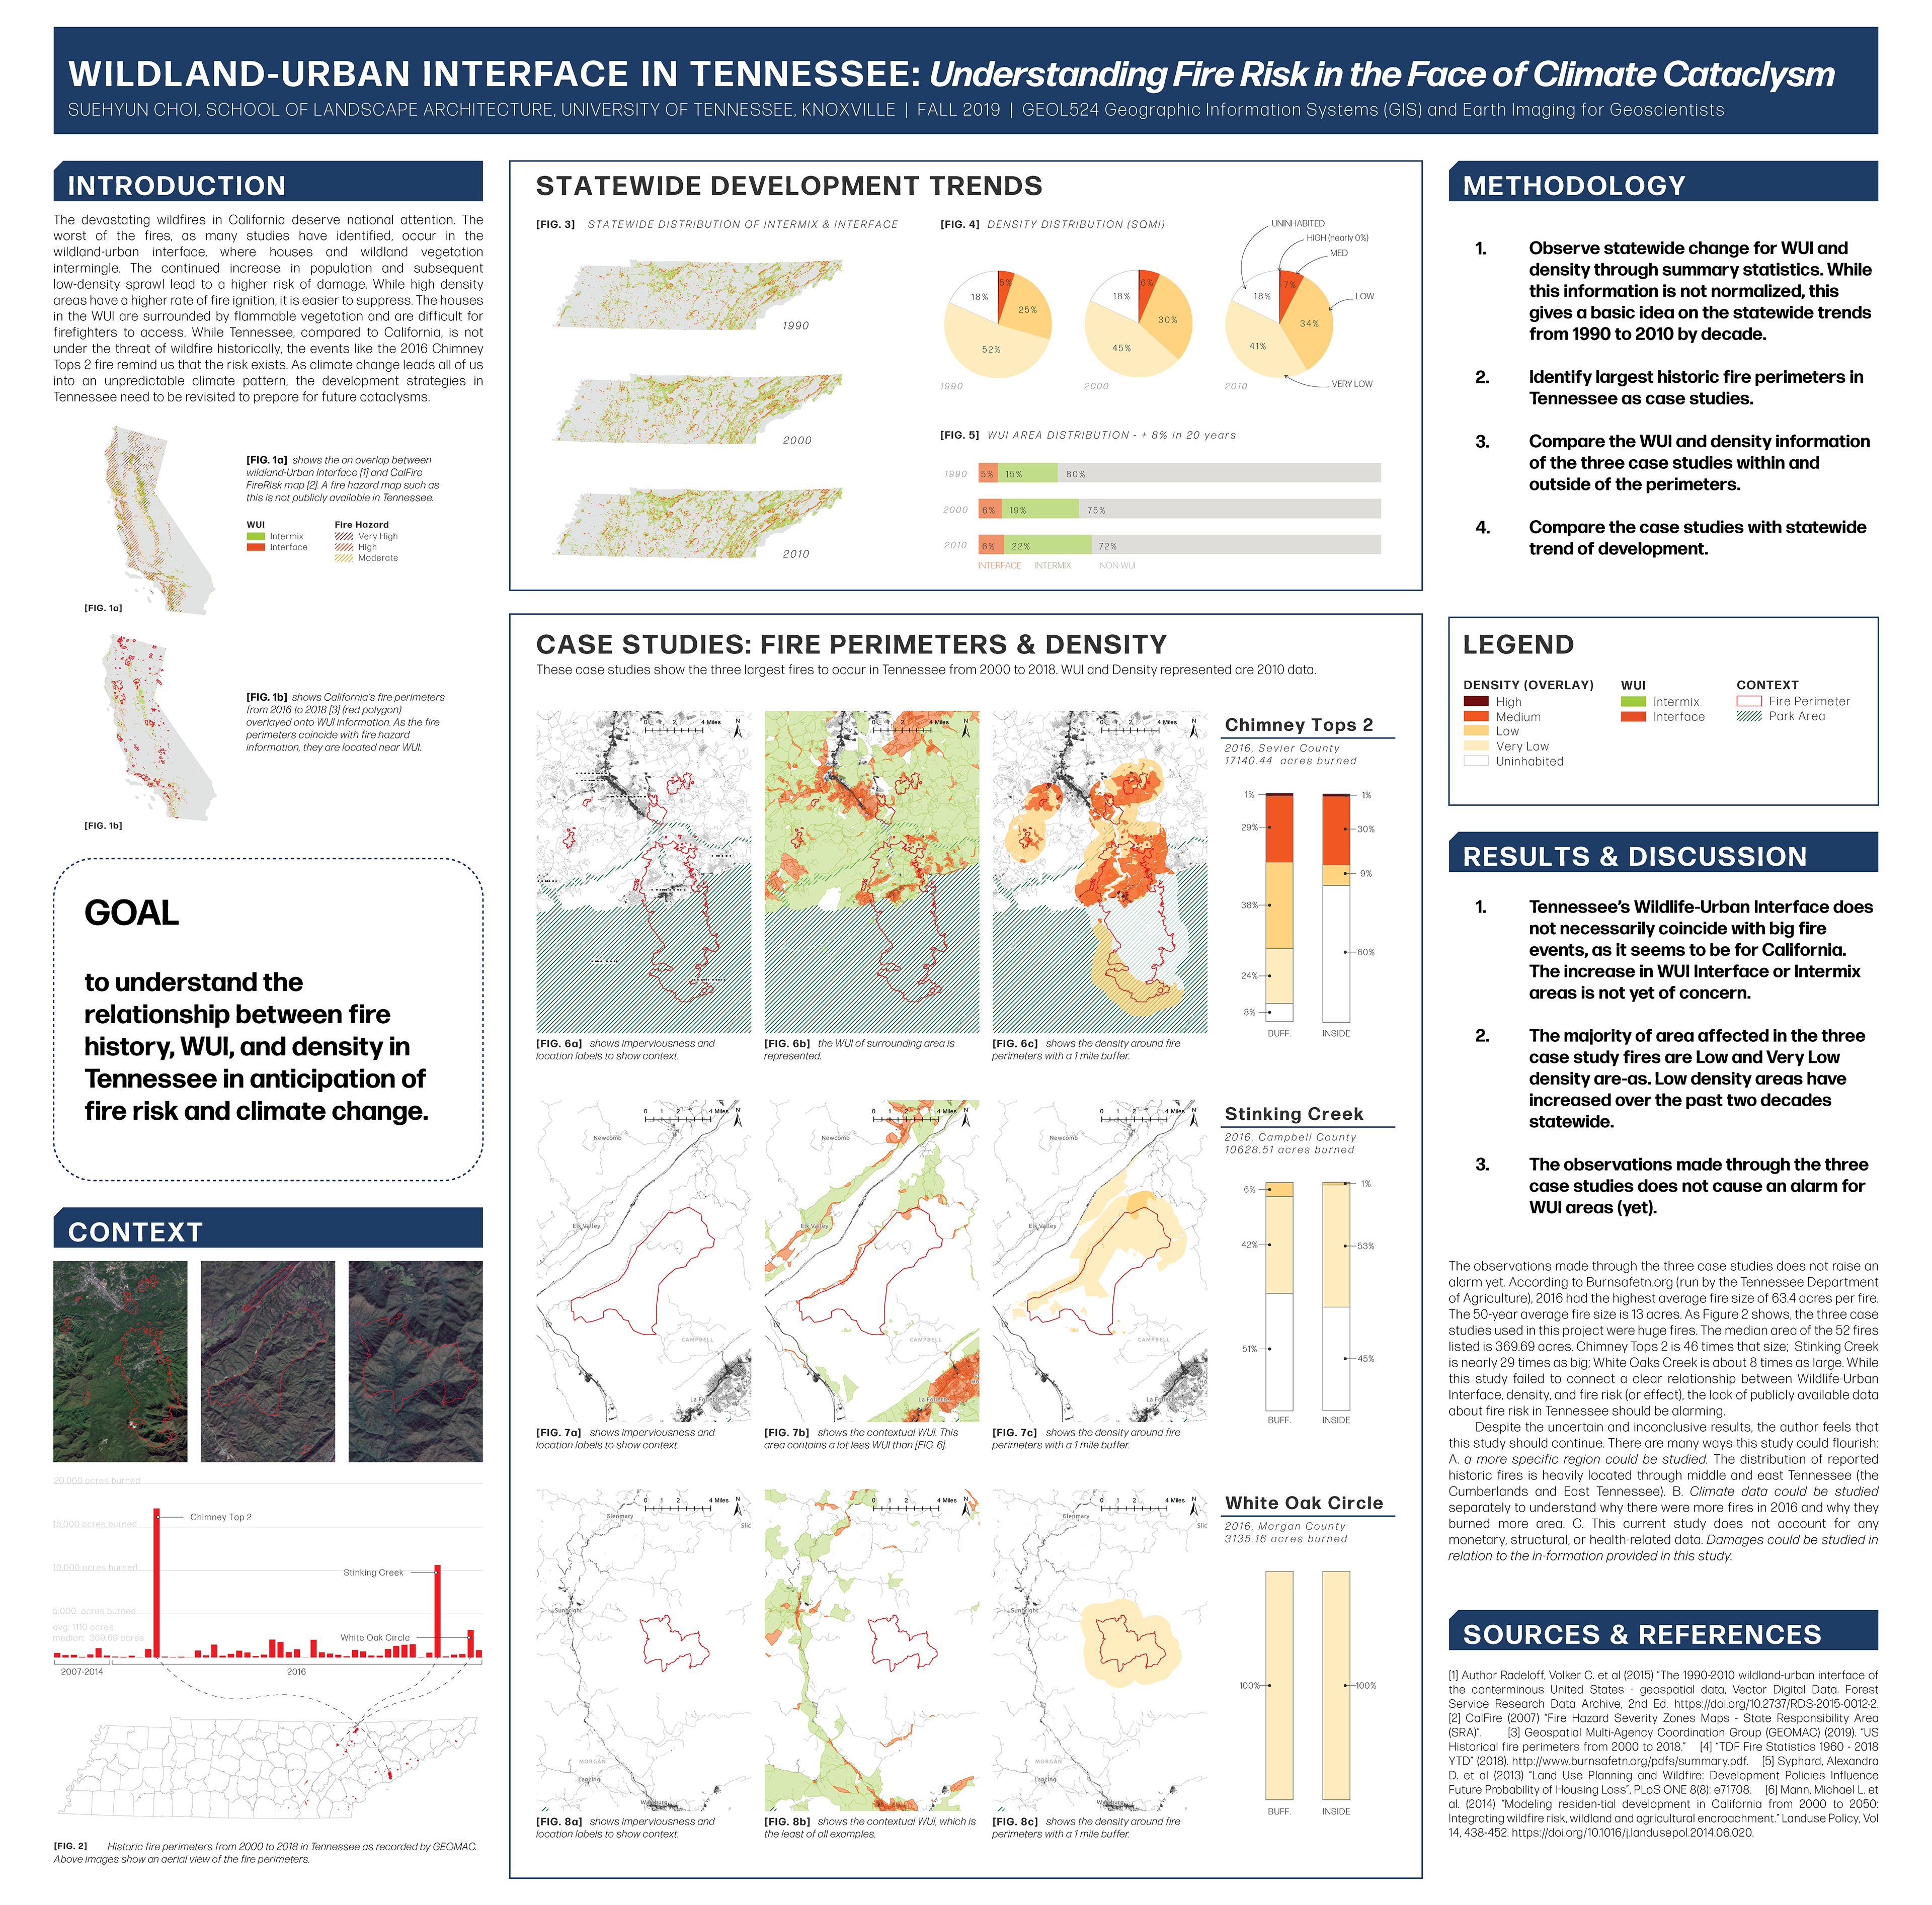
The devastating wildfires in California deserve national attention. The worst of the fires, as many studies have identified, occur in the wildland-urban interface, where houses and wildland vegetation intermingle. The continued increase in population and subsequent low-density sprawl lead to a higher risk of damage. While high density areas have a higher rate of fire ignition, it is easier to suppress. The houses in the WUI are surrounded by flammable vegetation and are difficult for firefighters to access. While Tennessee, compared to California, is not under the threat of wildfire historically, the events like the 2016 Chimney Tops 2 fire remind us that the risk exists. As climate change leads all of us into an unpredictable climate pattern, the development strategies in Tennessee need to be revisited to prepare for future cataclysms.
GOAL
The goal of this study is to study wildland-urban interface in the Tennessee region and its relationship to historical fire perimeters to see if there is a relationship between the two. Statewide fire risk GIS maps do not exist for Tennessee like it does in California. Instead, studying the fire risk conditions in California and its overlap with the WUI and historic fire perimeters informs observations.
METHODOLOGY
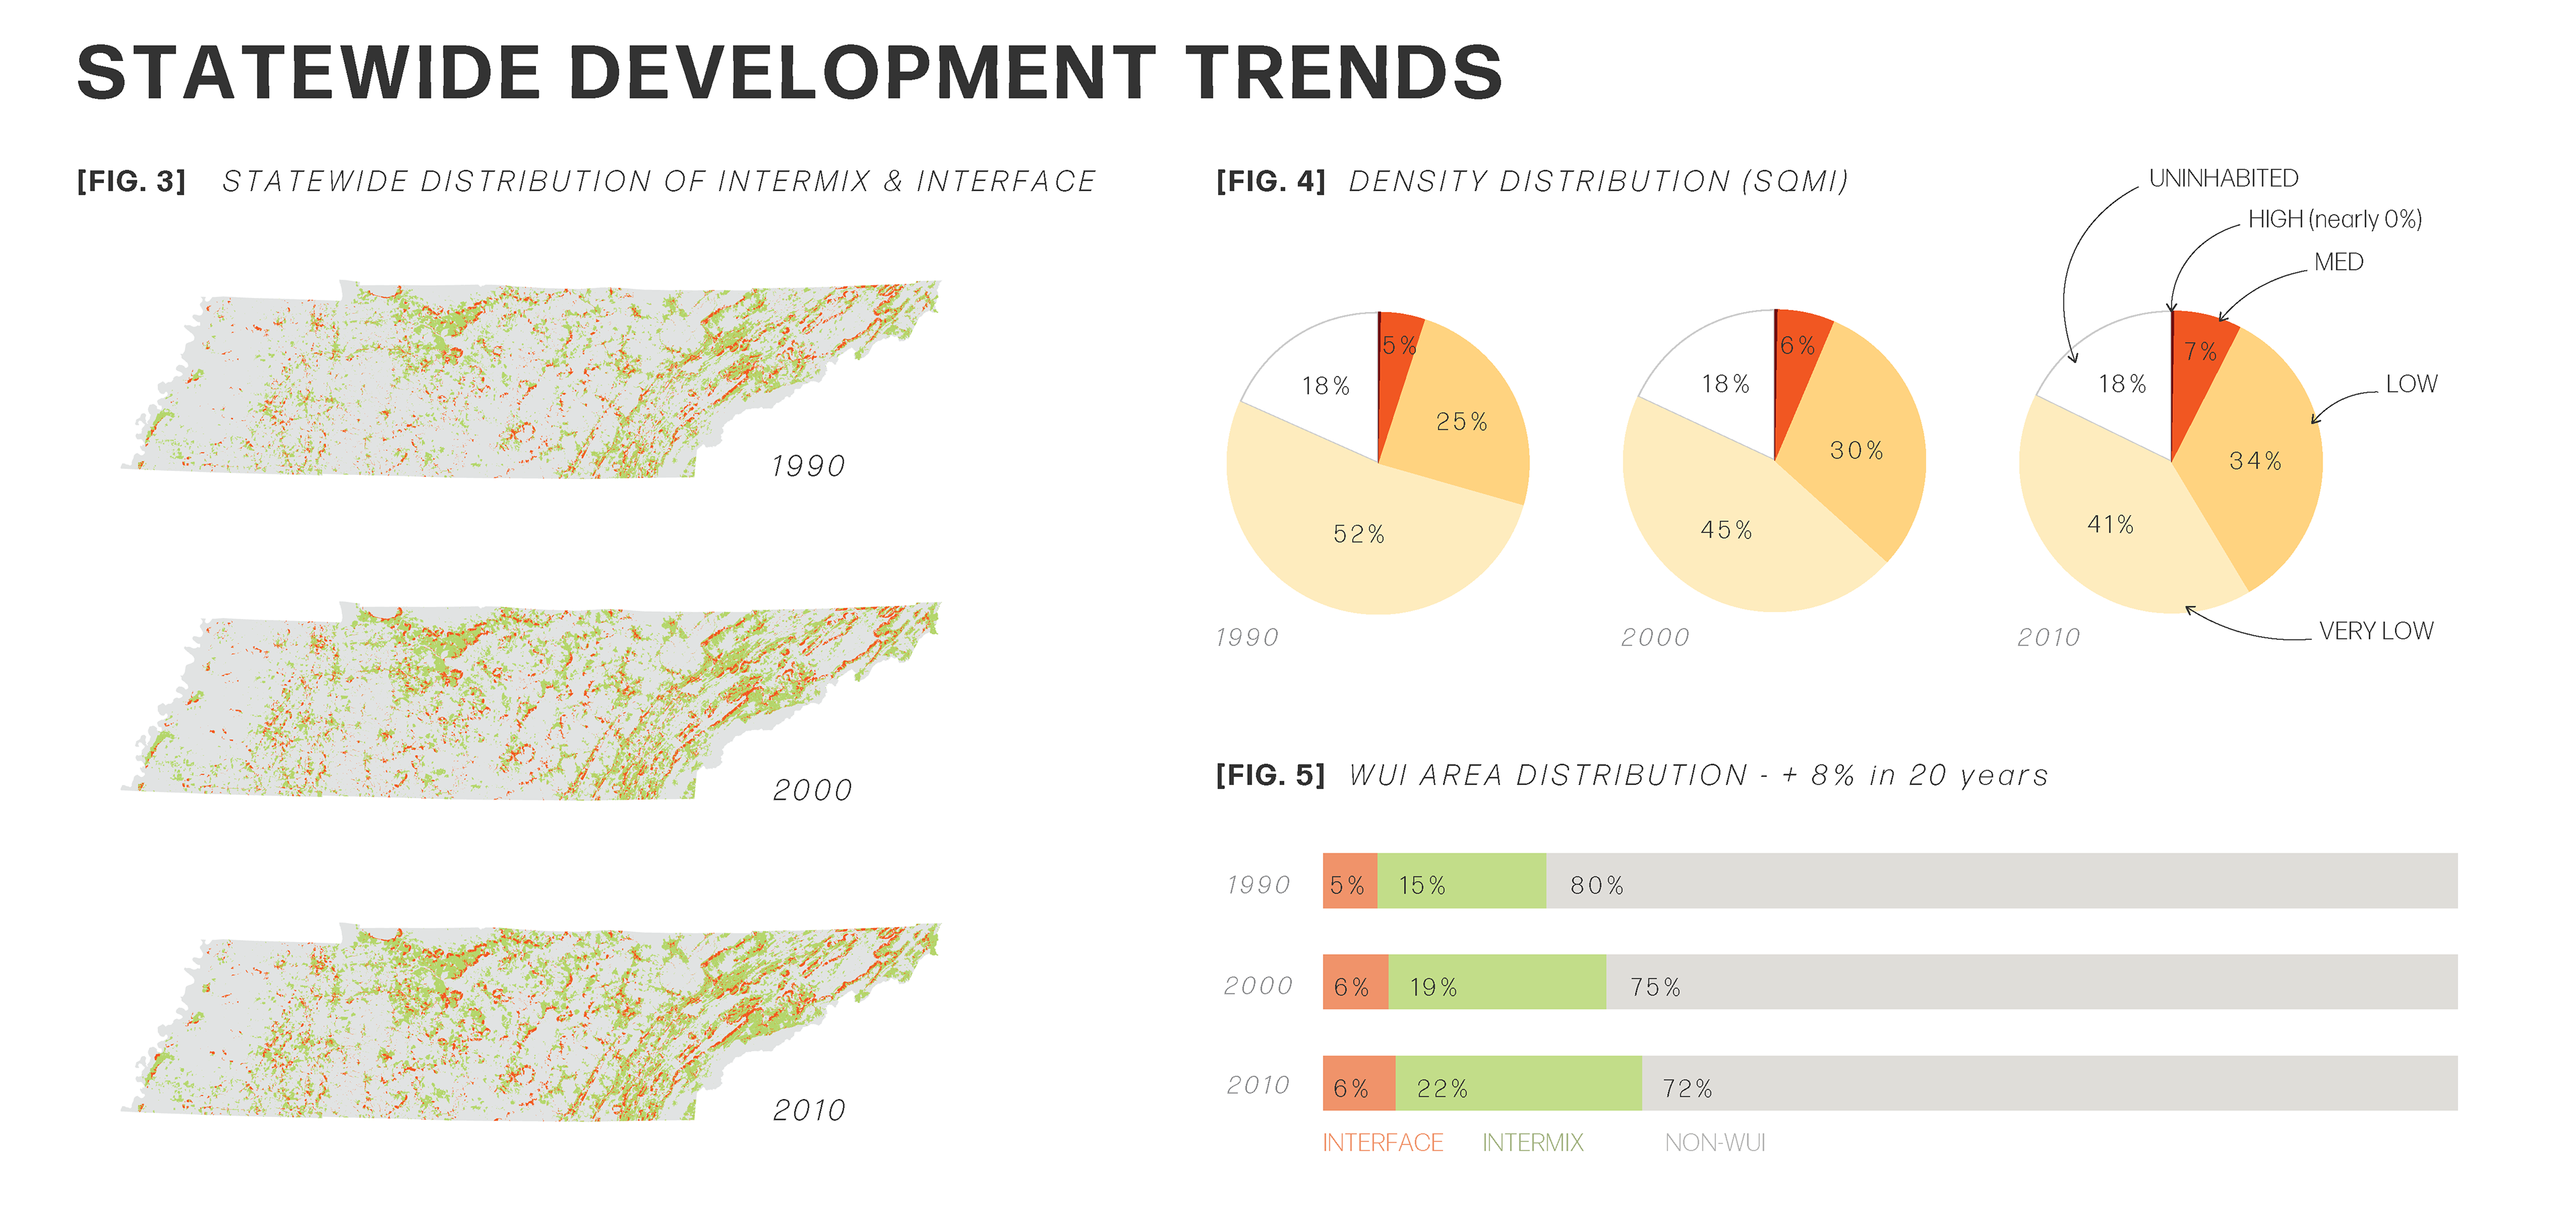
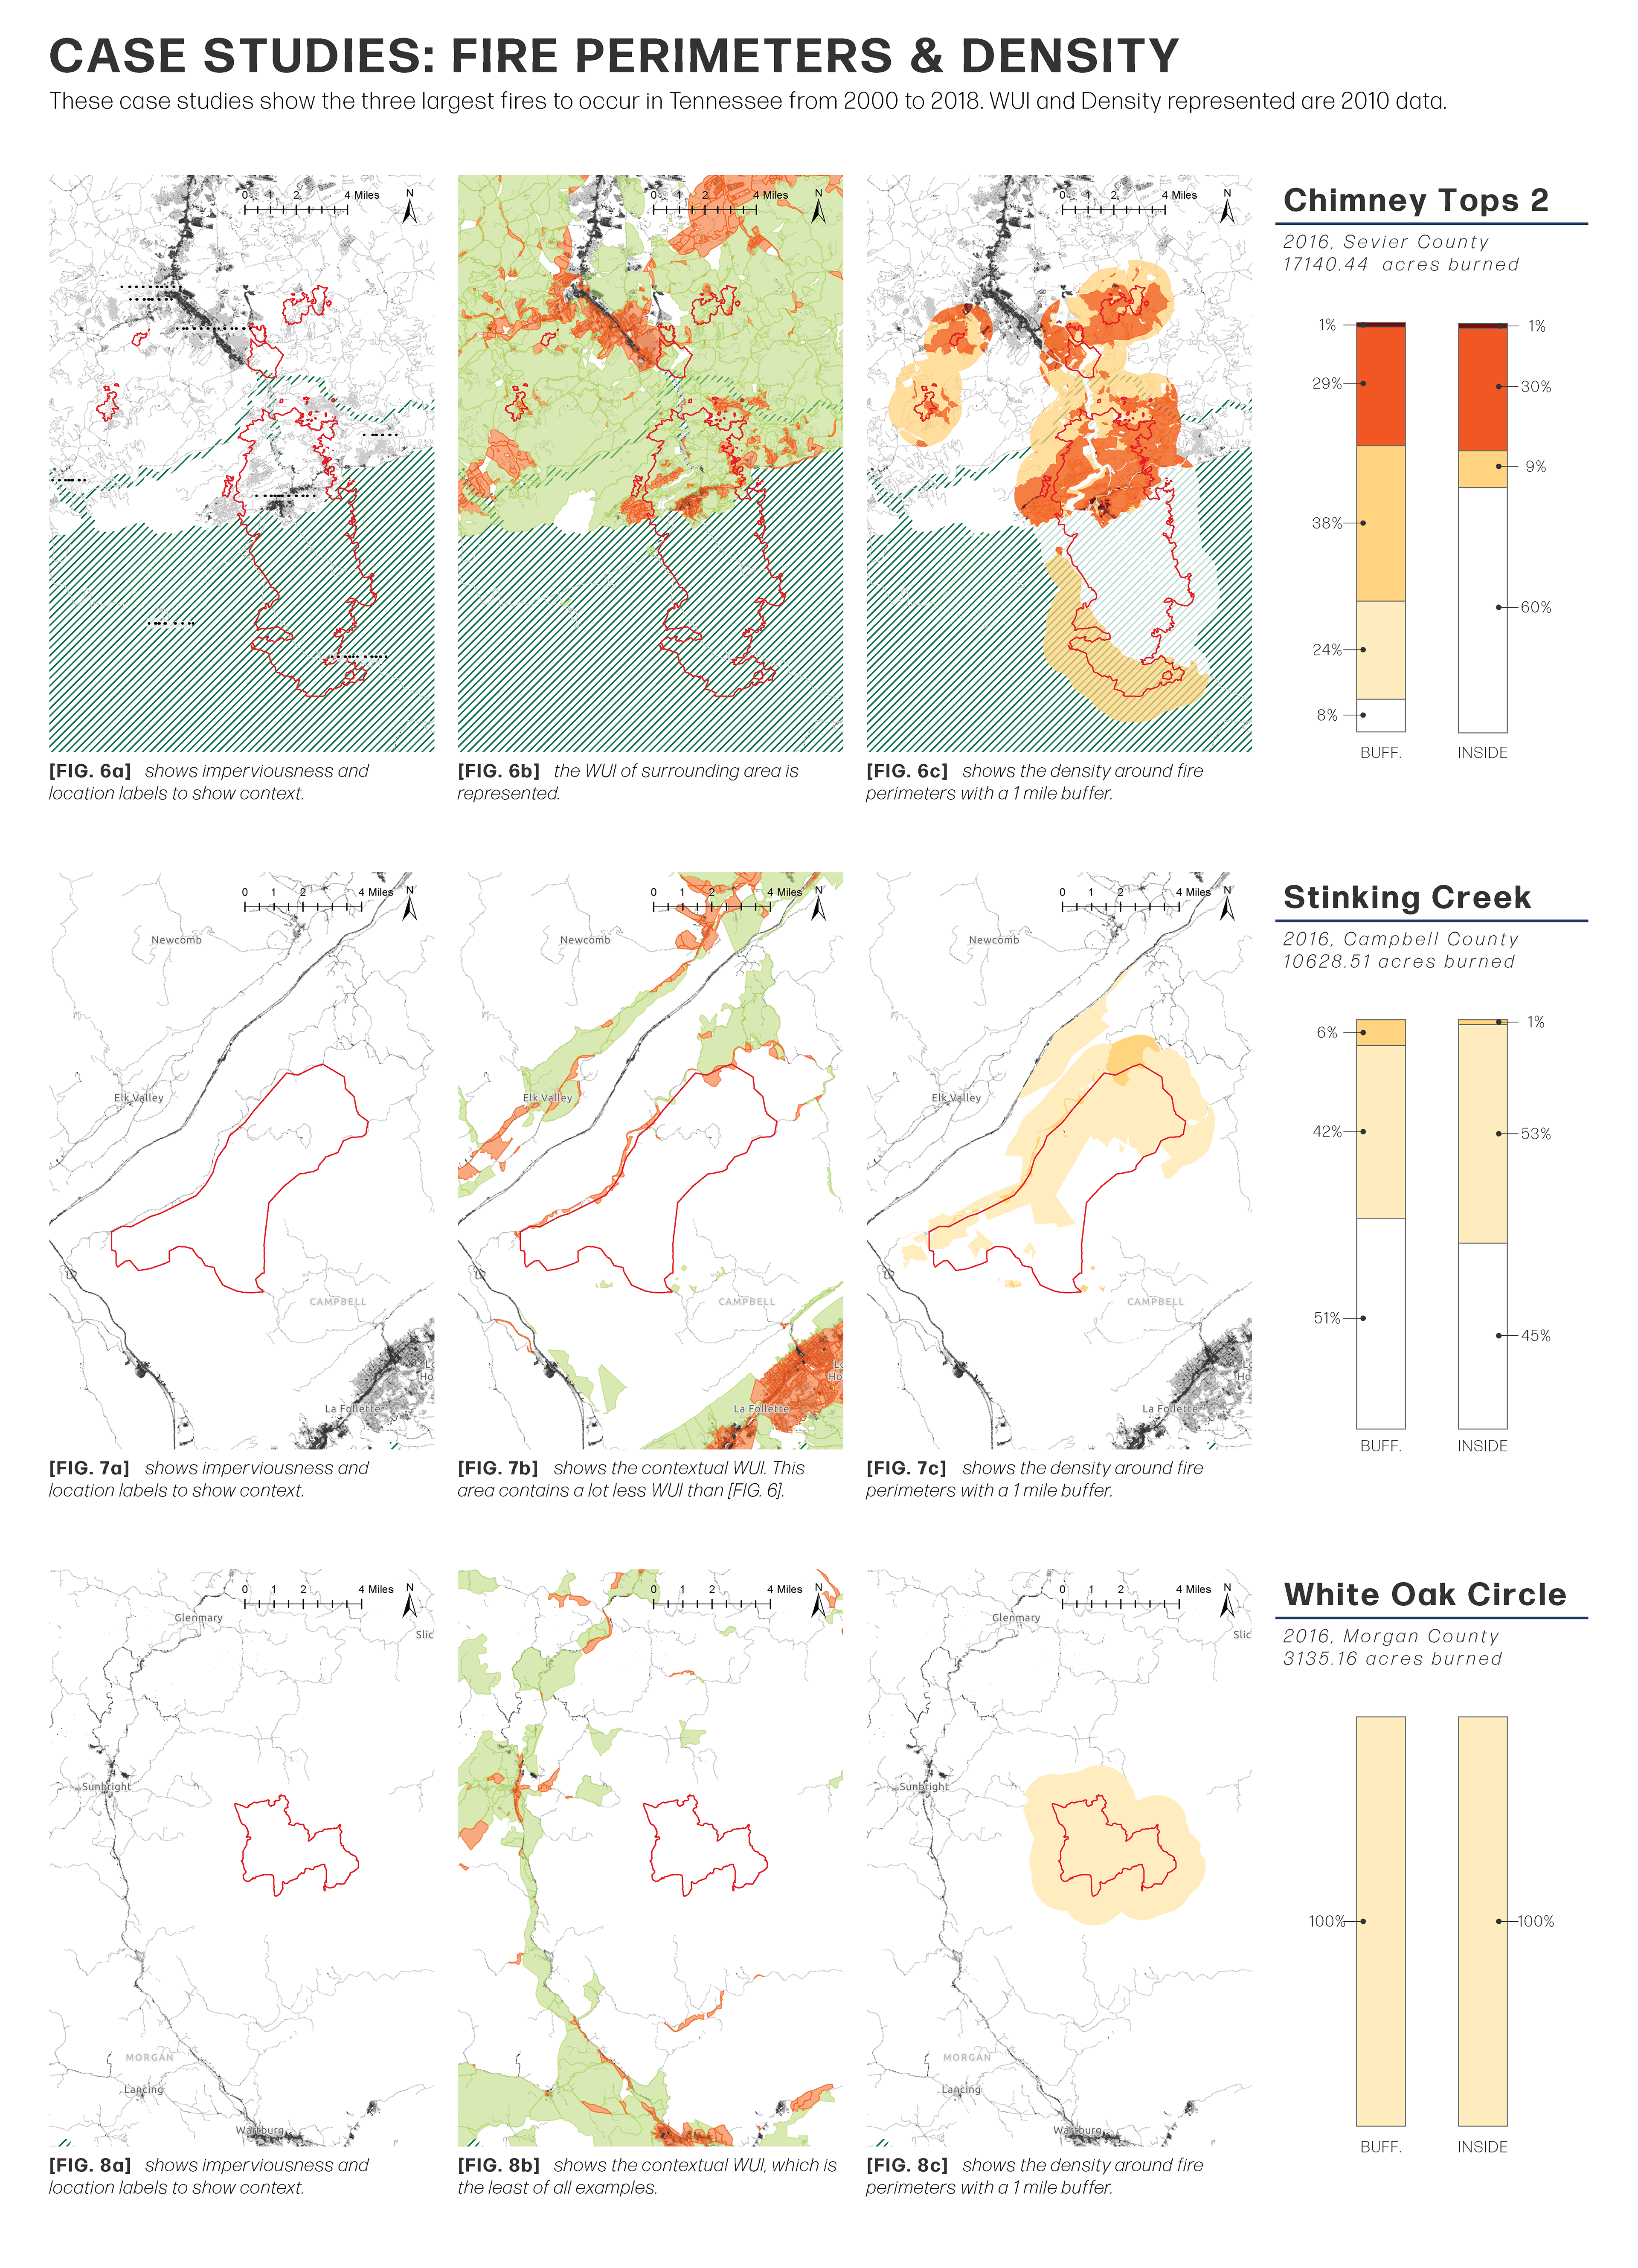
The methodology to this study is as follows. (1) Observe statewide change for WUI and density through summary statistics. While this information is not normalized, this gives a basic idea on the statewide trends from 1990 to 2010 by decade. (2) Identify historic fire perimeters in Tennessee as case studies for the prompt. For the sake of this study, I have chosen three fire events with the largest areas [3]: Chimney Tops 2 (17,140.44 acres), Stinking Creek (10,628.51 acres), and White Oak Circle (3,135.16 acres). All three of these fires occurred in 2016, which might lead to another interesting study. (3) Compare the WUI and density information of the three case studies within and outside of the perimeters. For this study, I created a 1 mile buffer outside of the perimeter and isolated that area from the interior of the perimeter. (4) Compare the case studies against the statewide trend of development.
RESULTS
For step (1a): While the uninhabited area is staying more-or-less the same (including water), the amount of Very Low density is decreasing, and Medium density and Low density is increasing. Specifically Low density areas have increased the most, from 25% of land area in 1990 to 34% of land area in 2010. This near 10% difference is taken from the Very Low density area. High density and Medium density areas have little to no increase in percentage.
(1b) Predictably, the WUI areas are also increasing over the decades. Non-WUI areas (which does not mean solely vegetation or solely development) has decreased by 8% from 1990 to 2010.
(2) The historic fire perimeters with largest areas are all characteristically different. The Chimney Top 2 fire that occurred in Gatlinburg and the Smokey Mountains is surrounded by WUI area, while Stinking Creek and White Oak Circle are not. Chimney Tops 2, therefore, included the most and diverse level of density. In the other two both case studies, Low, Very Low, or Uninhabited were the areas affected.
(3) With the exception of Chimney Top 2, there was not a big difference between densities within and outside of the fire perimeter. The suspicion that there could be a difference between density affected by fire and density surrounding it is not necessarily proven. For Chimney Top 2, because the fire extended into the Smokey Mountains National Park, a good majority within the affected area is uninhabited vegetation.
(4) As most of the effected area within and outside of the fire perimeter is Low and Very Low density, the statewide increase of Low density, as opposed to Medium or High density may be concerning. Regarding WUI, the three case studies do not necessarily show a s close proximity between fire perimeter and intermix and interface areas. The increase in WUI areas in Tennessee may not be an alarming factor.
DISCUSSION
This extremely nonconclusive study made a few unvalidated observations:
1. The rigor of scientific research (especially committing to a repeatable methodology) is outside of the author’s comfort zone, and the author faces an existential quest to determine whether this is a skill to hone or dismiss.
2. Tennessee’s Wildland-Urban Interface does not necessarily coincide with big fire events, as it seems to be for California.
3. The majority of area affected in the three case study fires are Low and Very Low density areas. Low density areas have increased over the past two decades.
The observations made through the three case studies does not raise an alarm… yet. According to Burnsafetn.org (run by the Tennessee Department of Agriculture), 2016 had the highest average fire size of 63.4 acres per fire. The 50-year average fire size is 13 acres. As Figure 2 shows, the three case studies used in this project were huge fires. The median area of the 52 fires listed is 369.69 acres. Chimney Tops 2 is 46 times that size; Stinking Creek is nearly 29 times as big; White Oaks Creek is about 8 times as large. While this study failed to connect a clear relationship between Wildland-Urban Interface, density, and fire risk (or effect), the lack of publicly available data about fire risk in Tennessee should be alarming.
Despite the uncertain and inconclusive results, the author feels that this study should continue. There are many ways this study could flourish: A. a more specific region could be studied. The distribution of reported historic fires is heavily located through middle and east Tennessee (the Cumberlands and East Tennessee). B. Climate data could be studied separately to understand why there were more fires in 2016 and why they burned more area. C. This current study does not account for any monetary, structural, or health-related data. Damages could be studied in relation to the information provided in this study. D. Zoom into development trends. The original intent of this study included looking at development patterns as described by Syphard [5]. Due to time and space constraints, that research had to be halted and will have to be observed at a future time.
Final Poster for the Study